Linux: Monitor Debian Linux with Zabbix VM

Zabbix is designed primarily as an IT infrastructure monitoring tool.
In this post we are going to run a Zabbix 6.2 appliance to monitor a Debian 11 linux machine.
First we need to download the appliance in a Open Virtualization format (.ovf) from the official Zabbix site and to import it at the VirtualBox.
We can find the appliance manual here.
After the appliance is ready and running we need to ssh into the VM to find the IP address (with the ip addr show command).
The default system password for the root user is zabbix.
Note: In my case I had to change the default VM network adapter to be on Bridged mode instead of NAT (I wanted the appliance to be at the same network with my linux host machine for simplicity reasons).
My Zabbix VM IP is the 192.168.1.14 and my Linux host machine IP is 192.168.1.10.
To be able to access the Zabbix web panel we need to browse the 192.168.1.14 IP from our Linux host machine and the default password for the Admin web user is zabbix.
Now we have ready the Zabbix server VM, we need to install and configure the zabbix agent at the Linux host machine as it follows:
# Install Zabbix repositoryInstall Zabbix agent2
wget https://repo.zabbix.com/zabbix/6.2/debian/pool/main/z/zabbix-release/zabbix-release_6.2-4%2Bdebian11_all.deb
sudo dpkg -i zabbix-release_6.2-4+debian11_all.deb
sudo apt update

# Install Zabbix agent2
sudo apt install zabbix-agent2

# Start Zabbix agent2 process and make it start at system boot.
sudo systemctl status zabbix-agent2
sudo systemctl restart zabbix-agent2.service
Then edit the following settings at the /etc/zabbix/zabbix_agent2.conf:
# IP address of Zabbix Server
Server=192.168.1.14
ServerActive=192.168.1.14

# Host Machine Info
HostMetadata=Linux
HostnameItem=system.hostname

# Option: ListenPort
ListenPort=10050
# Option: ListenIP
ListenIP=192.168.1.10
after saving the configuration file restart the zabbix agent service and ensure that is running correctly:
# Restart the zabbix agent and ensure that is running
sudo systemctl restart zabbix-agent
sudo systemctl status zabbix-agent
sudo netstat -ntlpu
Note: You might need to update your firewall and open TCP port 10050 at your host machine.
Now we have configured the zabbix agent, let’s add the Host at the Zabbix inventory!
From the left sidebar navigate at the Monitoring -> Hosts menu item and press the Crerate host button at the top right corner.
We need to provide the Host Name, the Host IP (Interface) and to assign the needed template for the monitoring.
We need to add the machine at the proper Host group.

If everything is ok we must be able to see values at the Linux host latest data.
It is time to create a Dashboard to monitor our Linux machine!
From the left sidebar navigate at the Monitoring -> Dashboards menu item and press the Crerate dashboard button at the top right corner.
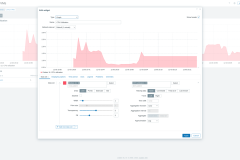
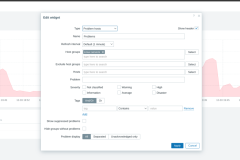
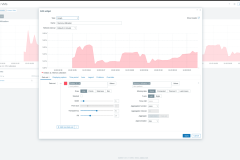
As for example we can add some Graphs to monitor the CPU and Memory Utilization, and another one Graph to monitor machines with problems or not.
The final dashboard looks like:


