Linux: Monitoring commands

There are a lot of cases that we might need to monitor eitrher the CPU and memory utilization or other stuff like network traffic, running process e.tc.
In this blog post we will share a list with some of the utilities that help us for the above reasons.
top
The top program provides a dynamic real-time view of a running system. It can display system summary information as well as a list of processes or threads currently being managed by the Linux kernel. The types of system summary information shown and the types, order and size of information displayed for processes are all user configurable and that configuration can be made persistent across restarts.

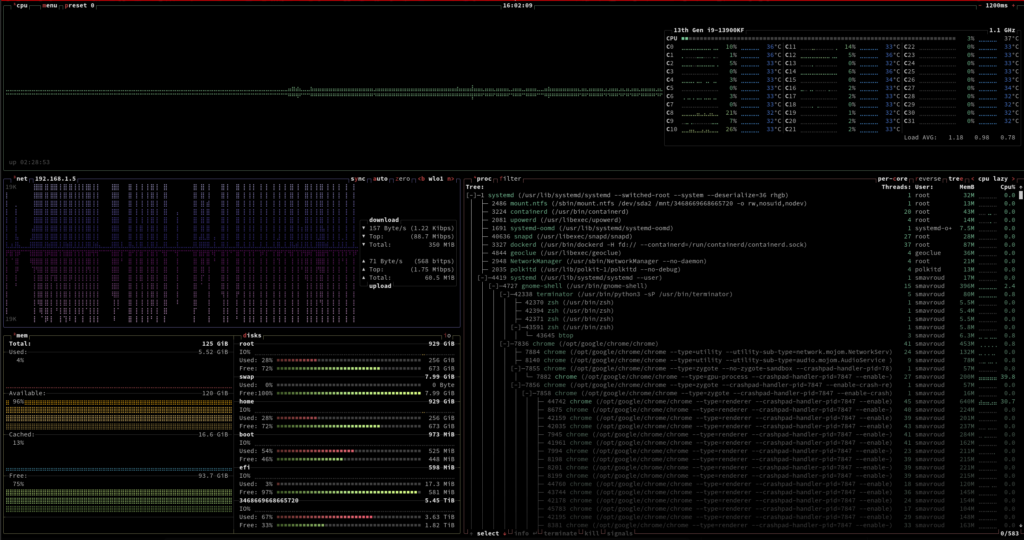
btop
Btop is a much-improved take on the Linux top command.
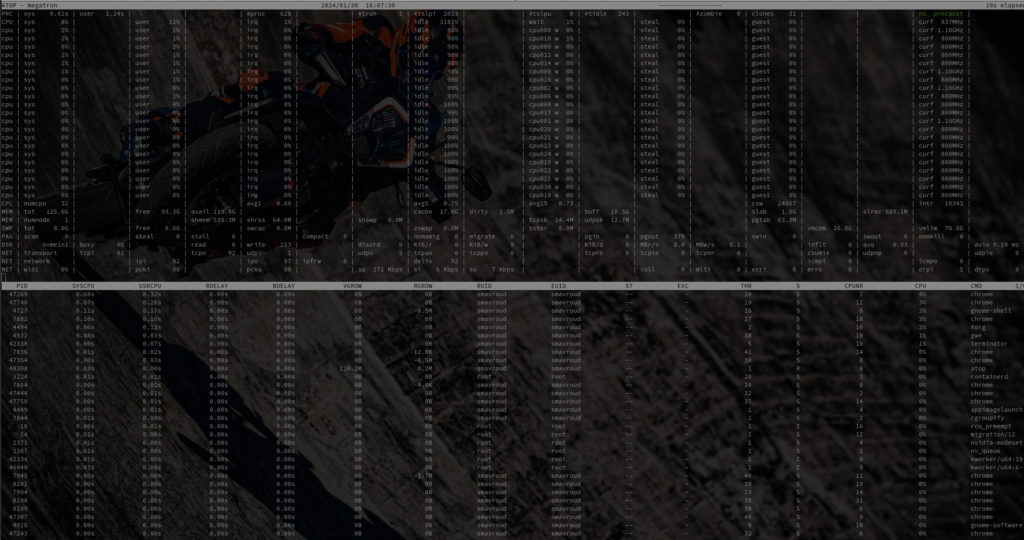
atop
Atop is an ASCII full-screen performance monitor for Linux that is capable of reporting the activity of all processes (even if processes have finished during the interval), daily logging of system and process activity for long-term analysis, highlighting overloaded system resources by using colors, etc. At regular intervals, it shows system-level activity related to the CPU, memory, swap, disks (including LVM) and network layers, and for every process (and thread) it shows e.g. the CPU utilization, memory growth, disk utilization, priority, username, state, and exit code.
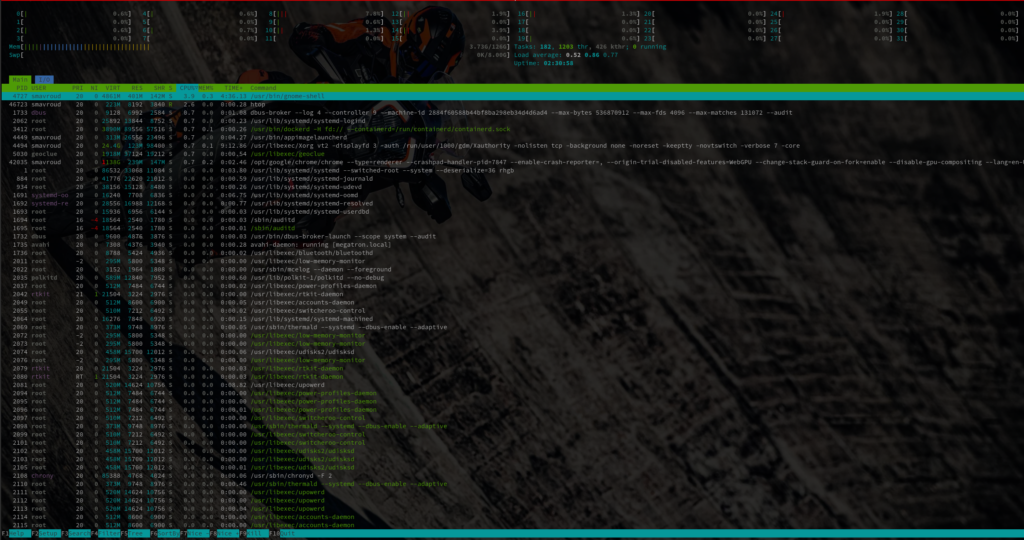
htop
Htop is a newer program compared to top command, and it offers many improvements over top command. htop supports mouse operation, uses color in its output and gives visual indications about processor, memory and swap usage. htop also prints full command lines for processes and allows one to scroll both vertically and horizontally for processes and command lines respectively.
ctop
Top like interface for container metrics.
Ctop provides a concise and condensed overview of real-time metrics for multiple containers, as well as an single container view for inspecting a specific container.

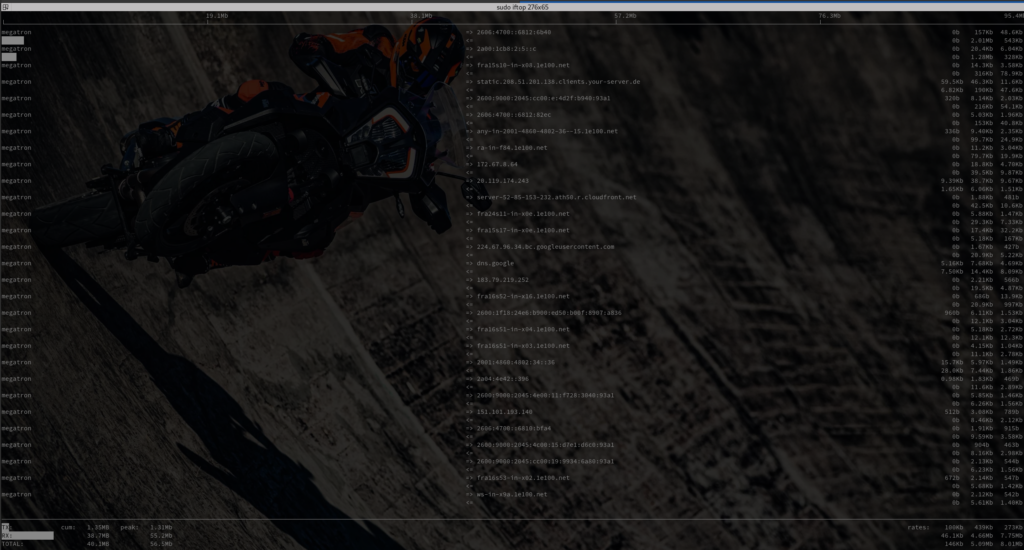
iftop
Iftop is a network analyzing tool used by system administrators to view bandwidth-related stats. It shows a quick overview of the networking activities on an interface.
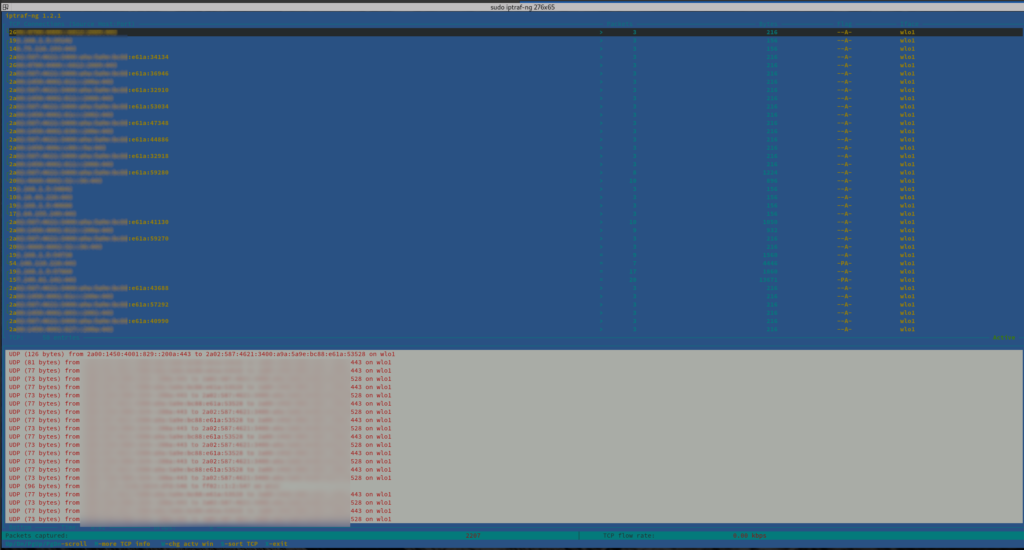
iptraf
Iptraf (iptraf-ng) is a console based Linux network statistics monitoring program that shows information about IP traffic, which includes information such as:
- Current TCP connections
- UDP, ICMP, OSPF, and other types of IP packets
- Packet and byte counts on TCP connections
- IP, TCP, UDP, ICMP, non-IP, and other packet and byte counts
- TCP/UDP counts by ports
- Packet counts by packet sizes
- Packet and byte counts by IP address
- Interface activity
- Flag statuses on TCP packets
- LAN station statistics
The iptraf utility can be used to find out the type of traffic on your network, and what kind of service is the most heavily used on what systems, among others.